

Most forex traders use candlestick patterns to predict the future direction of the price movement.
What is a candlestick?
A candlestick is a way of displaying information about an asset’s price movement. Candlestick charts are one of the most popular components of technical analysis, enabling traders to interpret price information quickly and from just a few price bars.
Over time, candlesticks build patterns that predict price direction once completed. Proper color coding adds depth to this colorful technical tool, which dates back to 18th-century Japanese rice traders.
Before you start trading, it’s important to familiarize yourself with the basics of candlestick patterns and how they can inform your decisions.
Hammer
The hammer candlestick pattern is formed of a short body with a long lower wick, and is found at the bottom of a downward trend.
A hammer shows that although there were selling pressures during the day, ultimately a strong buying pressure drove the price back up. The colour of the body can vary, but green hammers indicate a stronger bull market than red hammers.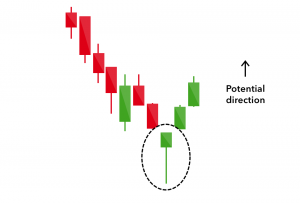
Inverse hammer
A similarly bullish pattern is the inverted hammer. The only difference being that the upper wick is long, while the lower wick is short.
It indicates a buying pressure, followed by a selling pressure that was not strong enough to drive the market price down. The inverse hammer suggests that buyers will soon have control of the market.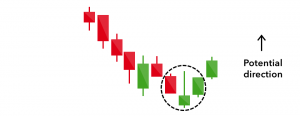
Bullish engulfing
The bullish engulfing pattern is formed of two candlesticks. The first candle is a short red body that is completely engulfed by a larger green candle.
Though the second day opens lower than the first, the bullish market pushes the price up, culminating in an obvious win for buyers.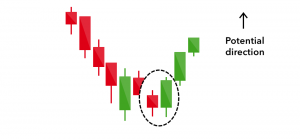
Hanging man
The hanging man is the bearish equivalent of a hammer; it has the same shape but forms at the end of an uptrend.
It indicates that there was a significant sell-off during the day, but that buyers were able to push the price up again. The large sell-off is often seen as an indication that the bulls are losing control of the market.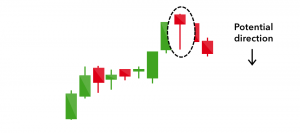
Shooting star
The shooting star is the same shape as the inverted hammer, but is formed in an uptrend: it has a small lower body, and a long upper wick.
Usually, the market will gap slightly higher on opening and rally to an intra-day high before closing at a price just above the open – like a star falling to the ground.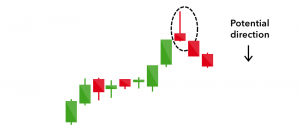
Bearish engulfing
A bearish engulfing pattern occurs at the end of an uptrend. The first candle has a small green body that is engulfed by a subsequent long red candle.
It signifies a peak or slowdown of price movement, and is a sign of an impending market downturn. The lower the second candle goes, the more significant the trend is likely to be.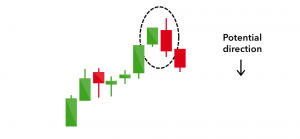
Start your forex trading journey today. Learn how to trade the world’s largest financial market. Join our Free Forex Trading webinars. Click here to register.
Source: This article is originally posted by IG.com. Click here to view it.
![]()


Leave a Reply