

This week, the market sentiment was unclear as investors weighed the reopening of several countries’ economy against risks of a second wave of infections. USD dipped lower as investors anticipated negative rates and the dire unemployment claims number released on Thursday. Elsewhere, oil prices pushed higher, breaking out to the upside of what many market observers refer to as a pennant pattern. This is a sign that the market is slowly rebalancing as major producers continue to announce supply cuts. Gold prices have surged over the last couple of weeks, supported by the current macroeconomic landscape.
CURRENCY: USDJPY
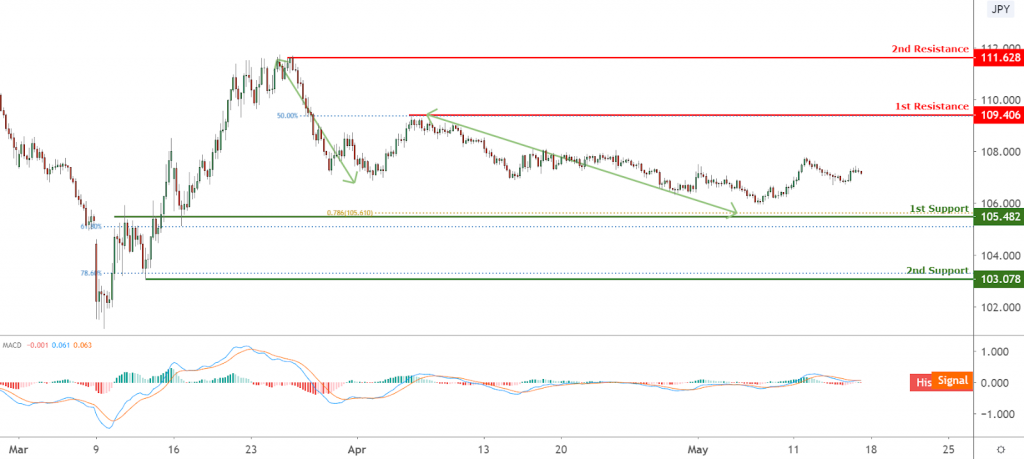 Price is in the middle of the 1st resistance and 1st support.The 1st support level happens to where the horizontal overlap support lines up with 78.6% fib extension. MACD shows that histogram is not clear in colours, indicating a mixed market sentiment.
CURRENCY: GBPUSD
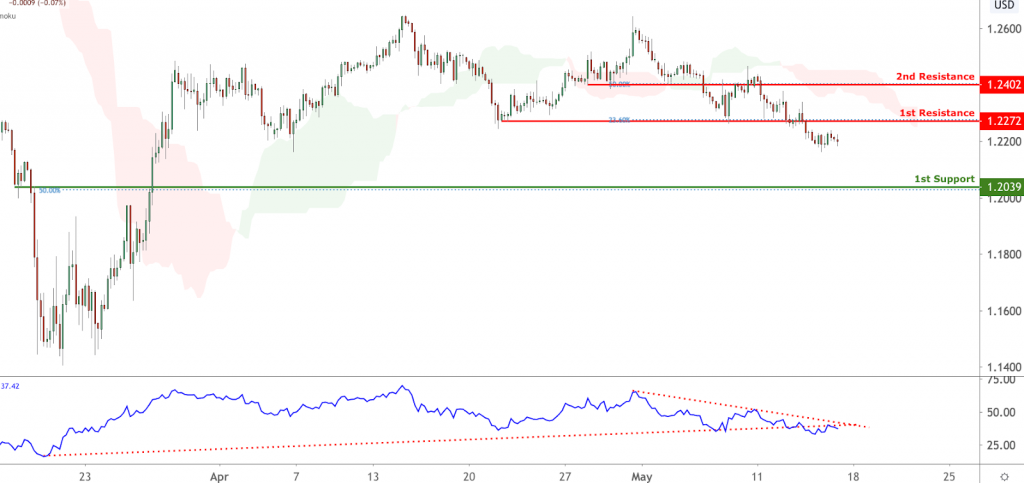 Price reversed nicely from our first resistance previously. This week, we remain bearish below our resistance, in line with our 23.6% fibonacci retracement where we could see a further drop to our first support level. Ichimoku cloud and RSI are showing signs of bearish pressure in line with our bearish bias.
CURRENCY: USDCNH
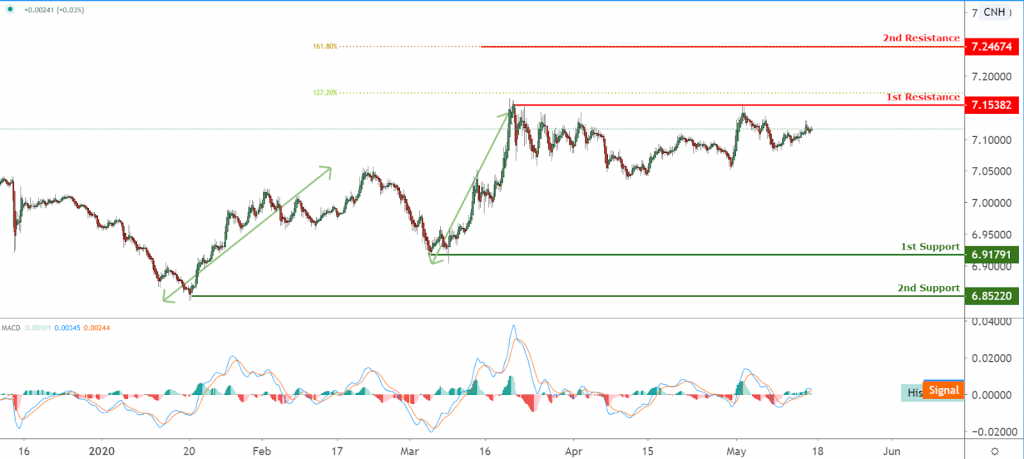 Price is facing bearish pressure as it went up to retest the 1st resistance where we remain bearish below this level. 1st resistance happens to be where the 127% fibonacci extension and horizontal swing high are. MACD is also showing a limited pushup towards 1st resistance before a drop is likely. As China is the first country to resume normal work and life in the Covic-19 turmoil, CNH could likely see some upside.

CURRENCY: SPX
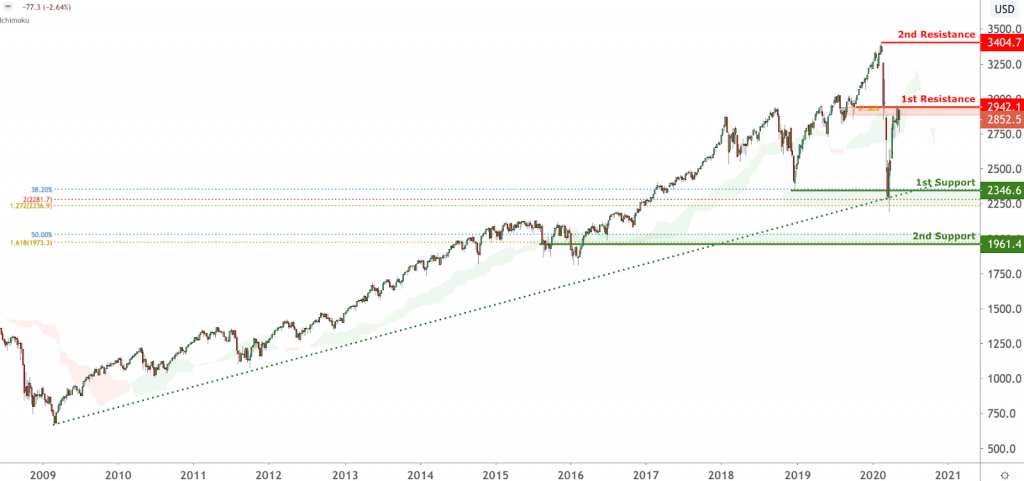 Price is testing our first resistance level in line with our 61.8% fibonacci retracement and horizontal overlap resistance, where we could see a reversal below this level. A break below our first support level could provide a bearish acceleration to our second support level.
CURRENCY: XAUUSD
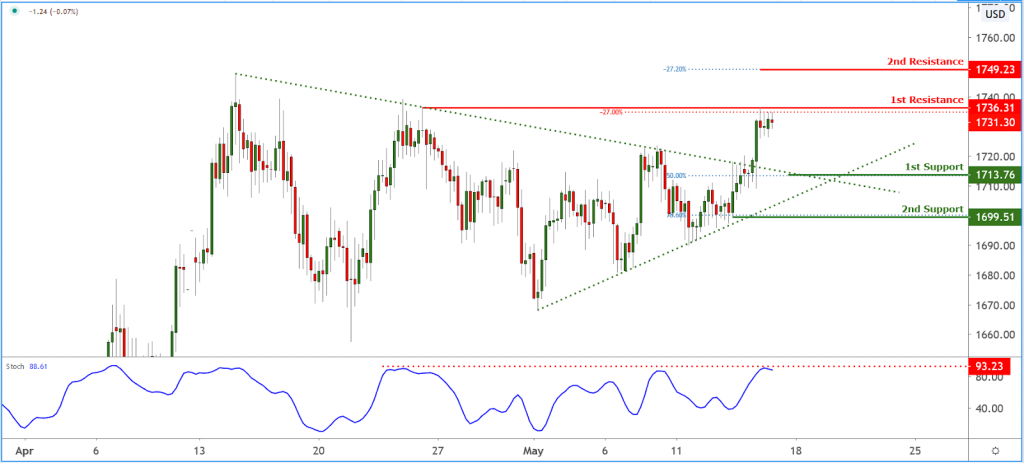 Gold broke above a descending trendline resistance (now support) over the course of this week and strengthened further testing its 1st resistance at 1736.31 region. A short term push down towards 1st support at 1713.76 could be possible given that stochastics is testing resistance as well where price reacted in the past. Otherwise, surpassing 1st resistance, we can expect to see price make a further push for 2nd resistance.
CURRENCY: WTIUSD (USOIL)
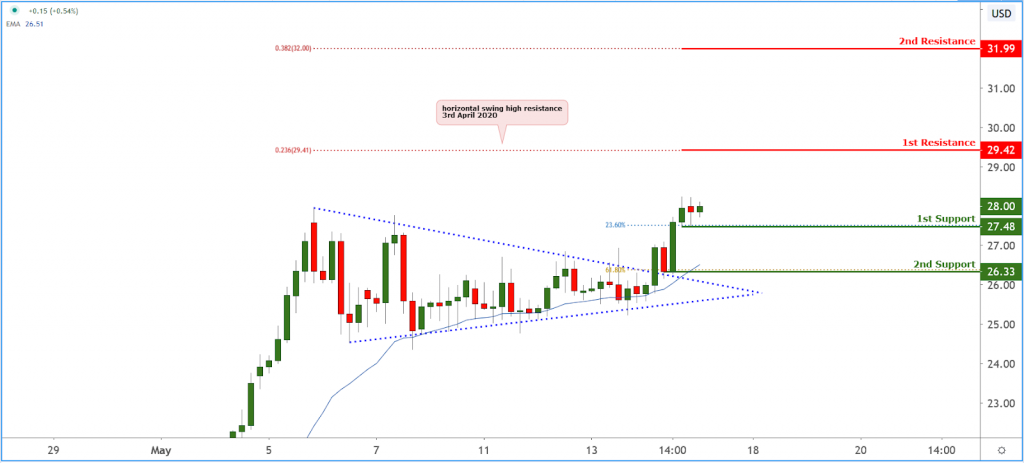 Oil price finally broke above it’s pennant chart pattern on news that major oil producers are looking to further production cuts. With prices holding above moving average, we can expect price to make a further short term push up towards 1st resistance at 29.42. The 1st resistance level is also a previous swing high back at the start of April.
Original Article by:
 Stephen Ines, AxiCorp’s Market Analyst
Click here to read the full article.


Leave a Reply